Last week I posted a brief overview of Lichtman’s 13-keys from his book Predicting the Next President: The Keys to the White House and applied them to today’s political landscape. From this assessment, Vice President Biden has a substantial lead. This week, my focus turned to battleground states and applying Lichtman’s keys to the states as individuals rather than in aggregate.
Would the Biden as victor prediction change if I created a state key system and applied it to a group of states? In every election, some states are safe for the incumbent, and some are up for grabs. I did not want to go diving through hundreds of surveys, trying to find the data for all states and territories. I wanted a way to screen out some states and evaluate the rest.
The Analysis
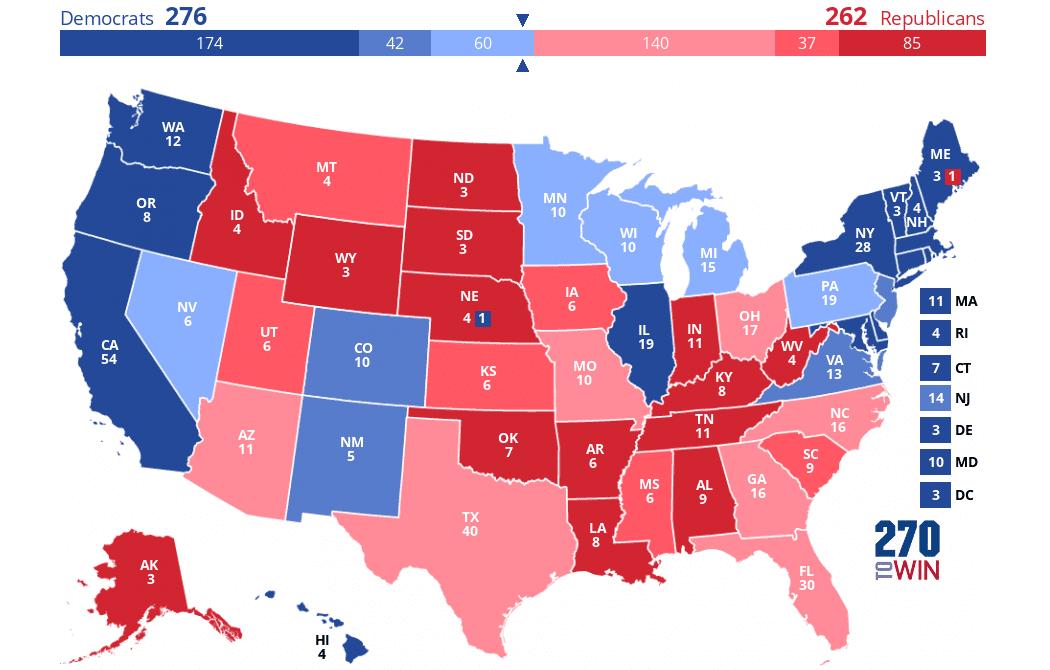
My analysis focuses on the battleground or swing states. I developed a method of screening out “safe” states, so I did not have to run my keys for every state. My first screening criterion was the state’s previous political leaning. I looked at the map and determined from 2016 who won, Trump or Clinton. From that list, I looked at who was currently leading in the polls. I used the RCP (Real Clear Politics) national average of Biden +7.5. I then determined that any state that President Trump won the 2016 election by greater than 6.5% or Secretary Clinton 6.5% would stay with the candidate’s party. If Vice President Biden’s lead were less than +6.5%, then the state would be up for grabs.

The second screening criteria I used was Ad Reservations. Using mediumbuying.com, I looked to see where the candidates were planning on spending money. Where did the campaign believe they had to either defend or win? Six states were already on my shortlist of 12, but surprisingly, Ohio, Iowa, and Texas were not, so I added them to my list, giving me 17 states (AZ, CO, FL, GA, IA, ME, MI, MN, NC, NE, NH, NV, OH, PA, TX, VA, and WI) to evaluate. At this point, This screened out 33 states and gave me an Electoral College Votes (EV) of 182 to Biden and 121 to Trump.
Once I had my list, I decided to manipulate Lichtman’s keys to be a more state-centric view. I created keys for the three broad categories; Political, Performance, and Personality keys.
All keys correspond to a true/false statement. For evaluation purposes, if the statement is true, the advantage is for the incumbent; if the statement is false, the challenger gets the key. For those questions centered on the opinions of the state residents, I used the most recent polling data.
The political category contains three keys that encapsulate incumbency, House change over, and the governorship. I initially thought that a President and Governor being from the same political party would be beneficial for the incumbent, but it is just the opposite after research.[1]
The Performance category, keys 4 thru 9, looks at items that motivate voters. Within this category, Economics was the most interesting of the keys. Of the hundred or so surveys that I looked at, almost all stated that the economy was their most significant concern and that President Trump was best suited to look after it. However, this was not a measure of President Trump against Vice President Biden. I looked at two measures of economic performance: the growth rate of state-level real GDP and the growth rate of average per capita personal income. If real GDP growth is positive for the most recent two-quarters of the economy (Q1 and Q2 2020), the statement is true. When the average personal income growth rate during the current Administration exceeds the average for the previous two administrations, the key is true.
For the first statement, all were false. A recession exists in every state analyzed. Regarding the second statement, in four states (GA, MI, MN, and OH), the average per capita personal income growth decreased since the Obama administration.[2]
A common polling question that I found was his job approval rating. When I initially started using the key, I awarded “true” if his approval rating exceeded 50%. However, all polls returned “false.” I went back to the third and fourth quarter of 2019, before the pandemic, and the data stayed the same. Therefore, his overall approval rating for the states that I analyzed was that his job approval was less than 50%. I thought about switching the question for this key to “Is his approval rating greater than his disapproval rating?” The outcome did not change. Even states like Virginia, North Carolina, and Texas, where he had several keys in his favor, those polled still maintained a negative view of his overall job performance.
Another question prevalent in more recent surveys focused on civil unrest, law and order, and social injustice. However, how much do protests in Portland influence the voters of my hometown of Huntington, West Virginia? For my analysis, I thought that might be a pretty good indicator. Had a state called their National Guard to state active duty due to social unrest? I was surprised to see that six of the fifteen had used their National Guard.[3]
The last of the performance keys was the President’s, or Federal Governments, response to the pandemic.
Overwhelmingly, those polled in the 15 states stated that the President had done a poor job. Not a single state had an approval rate of his response to the coronavirus above the mid-30s.
The Personality keys are the most subjective and the only one that looks at Vice President Biden.
These questions are very straightforward. “Do you have a favorable opinion of President Trump and former Vice President Biden”? This question is independent of performance. Some polls added character descriptors; others did not. Again, overwhelmingly, the view of those polled had a negative favorability on President Trump. What was interesting was three states (ME, OH, WI) were the only ones to have a positive favorability (greater than 50%) of the former Vice President.
Final say? Running all of the keys, adding to the screened out states, the former Vice President will win the election with an electoral college tally of 406 votes to 132 votes at the end of the day.

Is there anything that President Trump could do to avoid this landslide? Yes. Most agree that there is little that he could do to lose the 121 EV that I have laid out with 2016 state victories. How to capture more EV from those battleground states? His behavior and messaging needs to change. Act as if he believes the pandemic is a serious threat and always wear a mask in public. Show a little empathy. Talk about solving racial injustice rather than instilling fear in the suburbs. He could flip three of my keys with minimal effort. For example, if he changes the opinion of the federal government’s response to the pandemic from a negative to positive, four states flip, and he gains 45 EVs. I also wonder how much of his job approval would go up if there was a better federal response to the pandemic.
[1] I remember discussing it with my father. He explained that he likes to balance power between the executive and the legislative branches and between the federal and state governments. This ideology seems to resonate with the majority of the population. Thus a governor from an opposing party benefits the incumbent, not the other way around. President Trump automatically received a true for each state since he is the incumbent.
[2] If I had stopped my data and surveys in the fourth quarter of 2019, President Trump would have overwhelmingly received trues for each of the states’ economic statements.
[3] In May, during a socially distanced happy hour with my mother-in-law in North Carolina, she made a comment wanting to know if we had heard that because of the rioters in Fayetteville, the governor had activated members of the National Guard.
States to watch come election day
A single key flips
- Virginia
- Nebraska
- North Carolina
- Wisconsin
Too close to call
- Texas
- Pennsylvania
States that ABSOLUTELY should be Biden, but!!!
- Georgia
- Florida
Where they are spending money, but should not have too
- Ohio
- Iowa
- Texas
What were my keys?
1. Incumbency Mandate – The House of Representatives lost more Democratic seats than Republican seats
2. Governor’s Party – The governor of the state is from an opposing party.
3. Incumbents lead – The incumbent has a lead in the polls
4. Short Economy – The economy of the state, measured by the growth rate of real GDP at the state level, is positive for the last two consecutive quarters.
5. Long Economy – Average per capita personal income (state-specific) during the incumbent’s time in office exceeds the average of the past two Administration’s average.
6. The incumbent’s job approval rating is higher than their disapproval rating
8 Even though there are protests going on the US, it has not really affected the state (Has the state deployed the National Guard or other large law enforcement events?)
9 National Policy on Coronovirus – the Administration deserves credit for making the extent of the outbreak better. A majority of the population believes the President has done a good job handling the CV outbreak. Split decisions go toward the incumbent.
10 Incumbent Charisma – the incumbent-party candidate is considered favorable, inspiring, and trustworthy. (Greater than 50% of the poll must agree) or the incumbent is considered more favorable than unfavorable
11 Challengers Charisma – the challenging-party candidate, is deemed to be favorable, inspiring, and trustworthy. (Greater than 50% of the poll must agree) or the incumbent is considered more favorable than unfavorable
Data sources
Real Clear Politics General Election poll data: https://www.realclearpolitics.com/epolls/2020/president/us/general_election_trump_vs_biden-6247.html
CBS News Poll https://drive.google.com/file/d/1jPWxDDUmxXxfuiGU01I_2liTRiRQrlfS/view
Social Unrest – https://www.visualcapitalist.com/mapping-civil-unrest-in-the-united-states-2000-2020/
– Govenors Party – https://en.wikipedia.org/wiki/List_of_United_States_governors
States Data:
AZ https://static.foxnews.com/foxnews.com/content/uploads/2020/09/Arizona.pdf
PA and FL – https://www.publicpolicypolling.com/wp-content/uploads/2020/08/GeorgiaAugust2020Poll.pdf
Georgia – http://www.surveyusa.com/client/PollReport.aspx?g=4b9009c4-ef1d-4774-a211-0c4402738ec8
Georgia – https://drive.google.com/file/d/1oa8SqHJAq6hBII_8LjgY0PjPwAgBWzpO/view
Iowa – https://www.termlimits.com/wp-content/uploads/2020/08/Iowa-Toplines-July-2020-1-1.pdf
Maine – https://drive.google.com/file/d/1QvLIr-Xi1OsOA_Ulz6jtWJnCZSN-1JyH/view
Maine – https://www.termlimits.com/wp-content/uploads/2020/08/Maine-Toplines-July-2020.pdf
North Carolina – https://www.monmouth.edu/polling-institute/reports/monmouthpoll_nc_090320/
North Carolina- https://static.foxnews.com/foxnews.com/content/uploads/2020/09/North-Carolina.pdf
New Hampshire – https://htv-prod-media.s3.amazonaws.com/files/saintanselmpollaugust20-1597956431.pdf
New Hampshire – https://scholars.unh.edu/survey_center_polls/601/?_ga=2.100925761.1501076666.1599860442-993541773.1599860442
Nevada- https://thenevadaindependent.com/article/poll-biden-up-by-5-in-nevada
Ohio –https://drive.google.com/file/d/1Vbmv7EXnwqeubTuvBYNiBvq565sOxi_9/view
Texas – https://giffords.org/wp-content/uploads/2020/09/TexasResults1.pdf
Texas – https://www.txhpf.org/wp-content/uploads/2020/08/THPFFinalAug17.pdf
Virginia – https://www.roanoke.edu/about/news/rc_poll_politics_aug_2020
Wisconsin – https://int.nyt.com/data/documenttools/crosstabs-MN-NH-NV-WI.pdf/80f8e4634fe6f880/full.pdf
Wisconsin Rasmussen reports – https://www.rasmussenreports.com/public_content/politics/elections/election_2020/wisconsin_biden_51_trump_43


